.png)

Dashboard Constructor
White Label Solution
A versatile no-code, plug-and-play, user-friendly solution for constructing dynamic, interactive, data-driven advanced analytics Dashboards with unprecedentedly sophisticated data visualization modalities, easily embedded into any other branded product or website.
What is Dashboard Constructor ?
Dashboard Constructor is a cutting-edge, plug-and-play, no-code SaaS solution for constructing tailor made analytics dashboards for your customers and clientele. Utilizing highly sophisticated and proprietary Front End and advanced data visualisation technologies, users can easily assemble their own advanced analytics dashboards, perfectly suited for a variety of use cases (industry monitoring, market intelligence, etc), with a choice of more than 40 distinct 2D and 3D data visualization types.
Uniquely, by storing data in a meta-format, the system automatically smart-matches user data with the types of advanced visualisation (dashboard components) it is compatible with, bringing for the first time a truly no-code ease-of-use to transforming data into eye-catching, attention-sustaining, functionally versatile and highly interactive advanced data visualisation.
How does the Dashboard Constructor work?
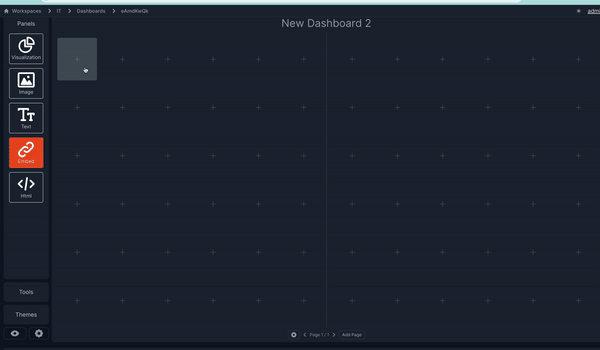
Dashboard Creation
The main Dashboard Constructor’s interface includes a central workspace where users can begin curating their data sets in a straightforward, no-code manner, without restriction. You are able to upload your own datasets, purchase additional data from our vast in-house library, or do both. In fact, several types of data can be used including data from external sources and platforms like DataBox.
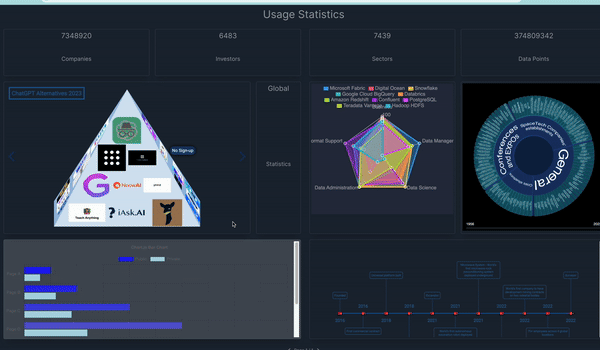
Visualisation
Once the data has been selected, you can enjoy a wide variety of advanced interactive visualisation types that work for you - including 8 major types of advanced 3D visualisations, 20 2D visualisation types, and 40+ variants across all modalities. From dynamic mind maps, graphs, charts and timelines - you have everything you need to make even the most complex data understandable in a mere glance.
Furthermore, to give you even better user experience, we have included data-to-visualisation intelligent matching, where our system analyses the data you have specified, and provides direct matches to visualisation types and dashboard components that can work with that data, by storing all the data in a meta format.
Each component can be individually configured with data sources and customised visual settings, all designed to capture and sustain audience attention with a fully adaptable aesthetic pleasing to your brand.
Integration
Visualisations can then be published as a zero code dashboard or adopted into your external product or website with true plug-and-play ease. Users are able to configure permissions for each dashboard, and even individual components (such as an interactive mindmap, 3D visualisation or simple char) can be shared.
Ultimately, you have the overall control and ability to create and share multi-page analytics and stunning visualisations with absolutely no coding or programming required.

Key Features of the Dashboard Constructor
Interactive Visualisations
A variety of dynamic, real-time data visualisations that make complex information easy to understand - 8 types of advanced 3D visualization, 20 2D visualization modalities, and 40+ variants across all types.
Fully Customisable
Personalise every aspect of your dashboard, including the ability to adjust the styling, layout, positioning and fonts to custom widgets and data visualisations
Enhanced Interactivity
Includes interactive elements like clickable industry maps and dynamic graphs, making the dashboards more engaging and informative
Mobile-Compatible
Access dashboard on-the-go, with a fully responsive design optimised to work seamlessly across all the latest devices
Secure & Scalable
With state-of-the-art integrated security software, the Dashboard Constructor is robust and reliable, built to handle large volumes of data and endless visualisation
Real-Time Preview
Changes to the dashboard can be previewed in real-time, allowing for immediate feedback and adjustments without the need for reloading
Advanced Visualisations at your fingertips
Transform your data, transform your business. Request exclusive access to the Dashboard Constructor in action, today.